Sample Size Table*
There are various formulas for calculating the required sample size
based upon whether the data collected is to be of a categorical or quantitative
nature (e.g. is to estimate a proportion or a mean). These formulas
require knowledge of the variance or proportion in the population and a
determination as to the maximum desirable error, as well as the acceptable Type
I error risk (e.g., confidence level).
But why bother with these formulas?
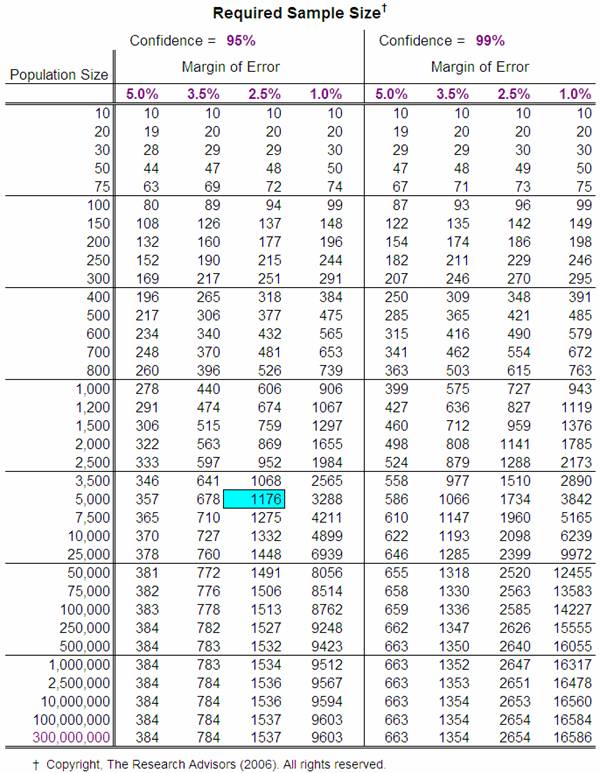
It is possible to use one of them to construct a table that
suggests the optimal sample size – given a population size, a specific margin
of error, and a desired confidence interval. This can help researchers
avoid the formulas altogether. The table below presents the results of
one set of these calculations. It may be used to determine the
appropriate sample size for almost any study.
Many researchers (and research texts) suggest that the first
column within the table should suffice (Confidence Level = 95%, Margin of Error
= 5%). To use these values, simply determine the size of the population
down the left most column (use the next highest value if your exact population
size is not listed). The value in the next column is the sample size that
is required to generate a Margin of Error of ± 5% for any population proportion.
However, a 10% interval may be considered unreasonably large.
Should more precision be required (i.e.,
a smaller, more useful Margin of Error) or greater confidence desired (0.01),
the other columns of the table should be employed.
Thus, if you have 5000 customers and you want to sample a
sufficient number to generate a 95% confidence interval that predicted the
proportion who would be repeat customers within plus or minus 2.5%, you would
need responses from a (random) sample of 1176
of all your customers.
As you can see, using the table is much simpler than
employing a formula.
Professional researchers typically set a sample size level
of about 500 to optimally estimate a single population parameter (e.g., the
proportion of likely voters who will vote for a particular candidate).
This will construct a 95% confidence interval with a Margin of Error of about ±4.4% (for large populations).
Since there is an inverse relationship between sample size
and the Margin of Error, smaller sample sizes will yield larger Margins of
Error. For example, a sample size of only 100 will construct a 95%
confidence interval with a Margin of Error of almost ±13%, too large a range for estimating the true
population proportion with any accuracy.
Note that all of the sample estimates discussed present
figures for the largest possible sample size for the desired level of
confidence. Should the proportion of the sample with the desired
characteristic be substantially different than 50%, then the desired level of
accuracy can be established with a smaller sample. However, since you
can’t know what this percentage is until you actually ask a sample, it is
wisest to assume that it will be 50% and use the listed larger sample size.
The number of sub-groups (or “comparison” groups) is another
consideration in the determination of a sufficient sample size.
Since the parameter must be measured for each sub-group, the size of the sample
for each sub-group must be sufficiently large to permit a reasonable (sufficiently
narrow) estimation.
Treat each sub-group as a population and then use the table
to determine the recommended sample size for each sub-group. Then use a
stratified random sampling technique within each sub-group to select the
specific individuals to be included.
If you would like to calculate sample sizes for different
population sizes, confidence levels, or margins of error, download the Sample
Size spreadsheet and change the input values to those desired.
|
|
|
|
Download the spreadsheet by clicking on the download button: |
|

Note: The spreadsheet
was designed for a 17” monitor, so you may have to resize it (“Zoom” it out).
The formula
used for these calculations was:

This
formula is the one used by Krejcie & Morgan in their 1970 article “Determining
Sample Size for Research Activities” (Educational
and Psychological Measurement, #30, pp. 607-610).
![]()
* Copyright, 2006, The Research Advisors (http://research-advisors.com), All
rights reserved.